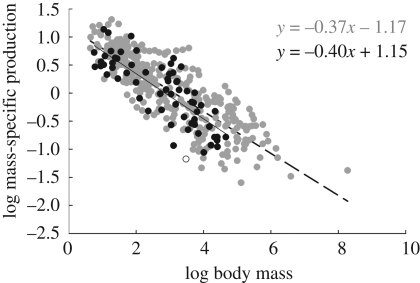
Figure 5.
Bivariate log–log plot of mass-specific production as a function of adult body mass. A GLM testing for differences in scaling among lineages finds no significant difference, and gives an overall slope of −0.37. See table 2 for further details.

