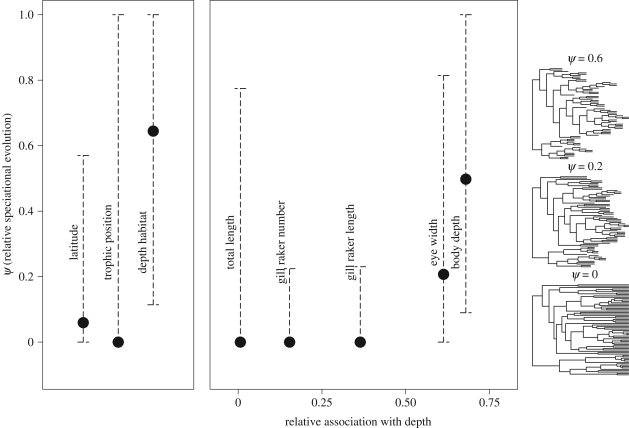
Figure 2.
Estimated contribution of speciation to the total rate of evolution of each character (ψ). Filled symbols indicate ML estimates of ψ, and error bars indicate the 95 per cent CI (±1.92 log-likelihood units). Morphological traits are arranged on the x-axis by their association with depth habitat relative to TP (table 1). The transformations of the Sebastes tree to the right show the branch lengths implied by three relevant values of ψ (0, 0.2 and 0.6).

