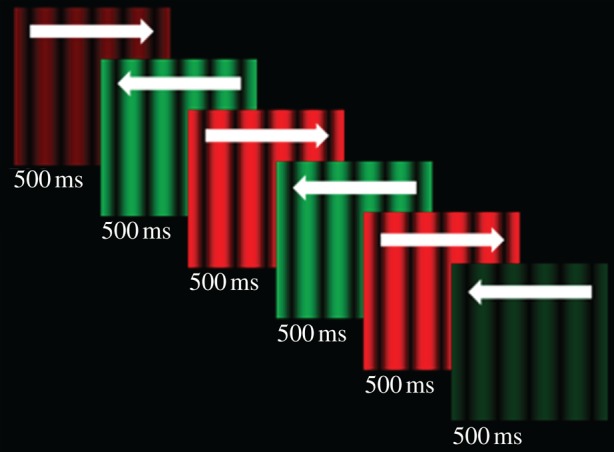
Figure 1.

Depiction of a test stimulus presentation. The stimulus oscillated in colour (green/red) and direction of motion (left/right). The peak luminance of the stimulus was linearly ramped on and off at the beginning and the end of each test presentation (for 500 ms). Here, we have depicted a situation wherein changes in direction and colour were physically synchronous, but in most trials colour changes were offset relative to direction changes. We have also depicted a situation wherein the start of the animation cycle is synched with the start of the test presentation. However, the starting point, in terms of the animation cycle, was determined at random on a trial-by-trial basis.
