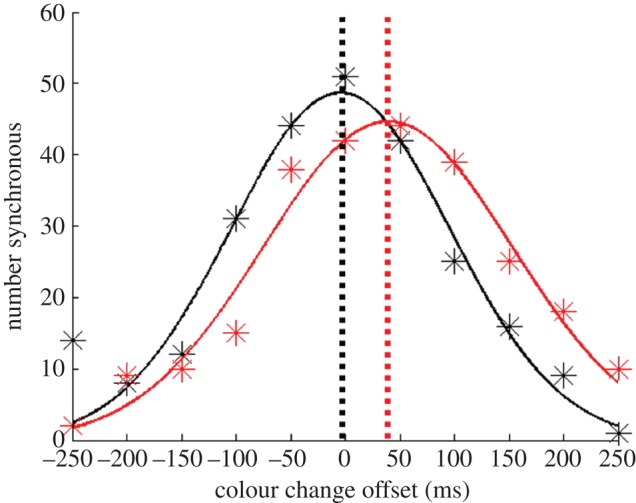
Figure 2.

Gaussian functions fitted to distributions of reported colour/motion synchrony, summed across all participants, as a function of the physical timing of colour changes relative to direction changes. Direction changes occurred at 0 ms. Data are derived from trial runs involving adaptation to colour changes that preceded (black) and lagged (red) direction changes by 200 ms. These data depictions are provided for illustrative purposes only. Statistical analyses were based on individual data fits, with differences taken from PSS estimates from runs of trials with and without adaptation.
