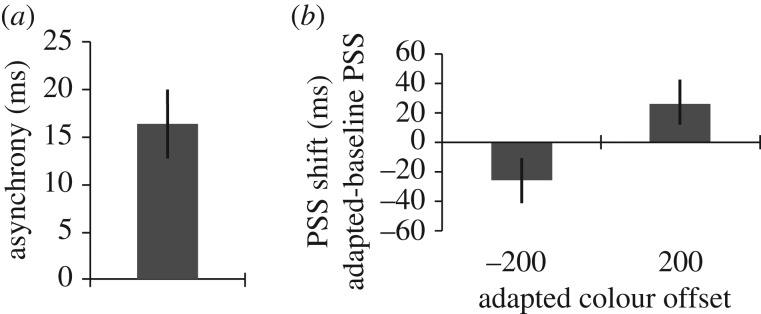
Figure 3.
Bar graphs depicting the results of this study. Error bars denote standard error. (a) Colour/motion perceptual asynchrony in baseline runs of trials. (b) Shift in the PSS for colour and direction of motion changes, from baseline, after adaptation to colour changes that led (−200 ms) and lagged (+200 ms) colour changes.

