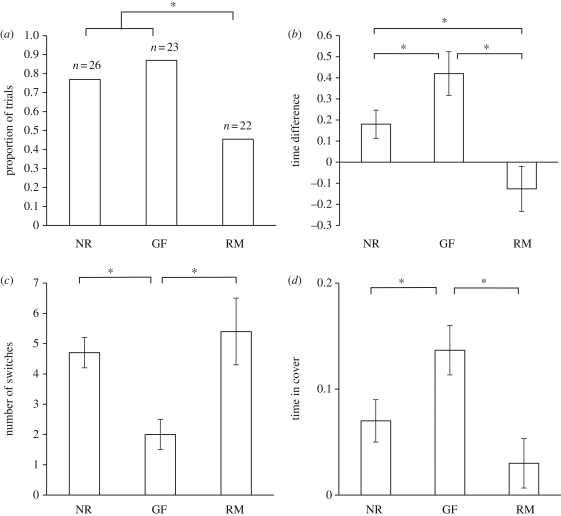
Figure 1.
Experiment 1: investigating public information use. (a) The proportion of fish choosing the rich patch first. Sample sizes are indicated above each bar. (b) Proportional time allocation (time in rich patch−time in poor patch, mean ± s.e.). (c) The number of switches between patches during the trial (mean ± s.e.). (d) Proportional time spent in cover (mean ± s.e.). Based on untransformed data. RM, reproductive males; GF, gravid females; NR, non-reproductives. *p < 0.05.

