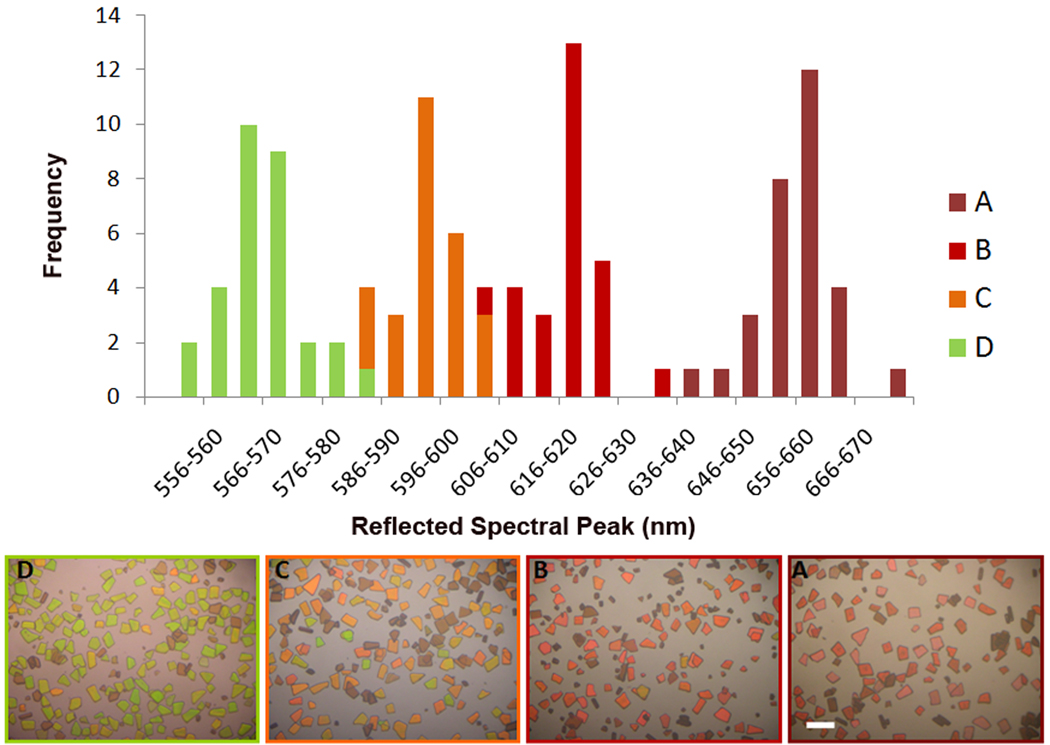
Figure 5.
Distribution of values of λmax in an ensemble of particles, monitored during degradation in aqueous solution. Data for sample A were obtained on the first day after immersion. Data for samples B, C, and D were obtained on day 7, and they correspond to pH 5, 7, and 9, respectively. Each bar represents a 4 nm wavelength range about the value indicated on the x-axis. Photographic color images of the representative ensembles are shown at the bottom. The scale bar is 100 µm.

