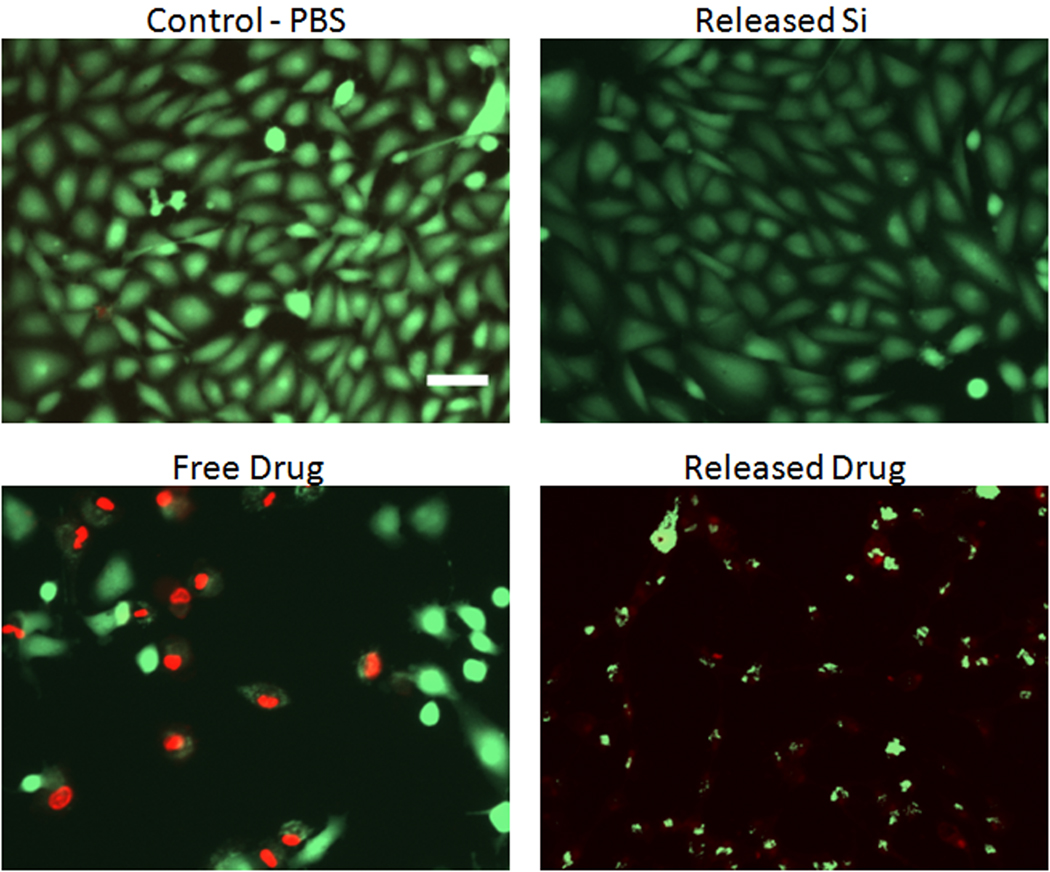
Figure 7.
Fluorescence microscope images of ARPE-19 cells comparing the toxicity of as-received daunorubicin (“Free Drug”), daunorubicin that had previously been attached to porous Si microparticles (“Released Drug”), and the soluble by-products of porous Si dissolution from non drug loaded porous Si (“Released Si”). A control experiment using PBS buffer only is shown for comparison (“Control-PBS”). The concentration of daunorubicin in the “Free Drug” and “Released Drug” images is 0.53 µg/mL. For the “Released Si” image, the soluble fraction of material released from a mass of porous Si microparticles equal to the mass of porous Si microparticles used in the “Released Drug” image was used. Green and red in images corresponds to calcein AM (live cells) and ethidium homodimer-1 (dead or damaged cells), respectively. The scale bar is 100 µm. Toxicity assessed 48 h after sample introduction.

