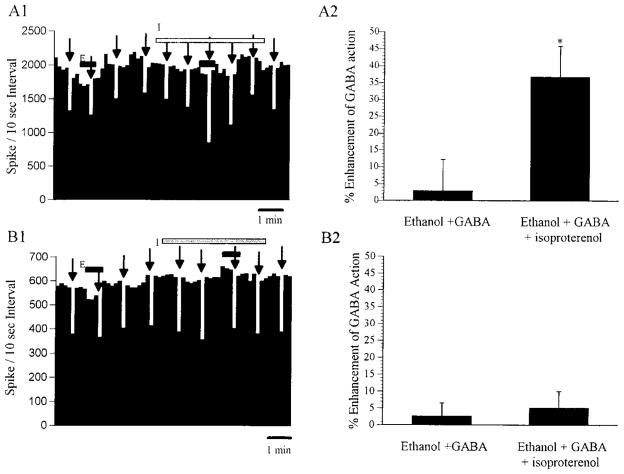
Fig. 4.
Rate histograms demonstrating the modulatory effects of isoproterenol on ethanol-induced potentiation of GABA inhibition from zolpidem-sensitive cerebellar Purkinje neurons. Closed horizontal bars represent the period of ethanol application, and hatched horizontal bar represents the period of isoproterenol application. (A1) Rate histogram demonstrating that ethanol (10 nA) had no effect on GABA action in the absence of isoproterenol, whereas after the application of isoproterenol (20 nA), ethanol was able to enhance the effects of GABA. (A2) The % enhancement of GABA action before and after the application of isoproterenol. Values represent the mean ± SEM derived from eight neurons in that the GABA actions were enhanced by ethanol in the presence of isoproterenol. Values represent the further enhancement produced by ethanol over the enhancement of GABA action by isoproterenol alone (57 ± 10%). *p < 0.05, compared with control. (B1) Rate histogram demonstrating that ethanol (10 nA) did not enhance the effect of GABA with or without the presence of isoproterenol (20 nA). (B2) The % enhancement of GABA action before and after the application of isoproterenol. Values represent the mean ± SEM derived from seven neurons in that the GABA actions were not further enhanced by ethanol in the presence of isoproterenol.

