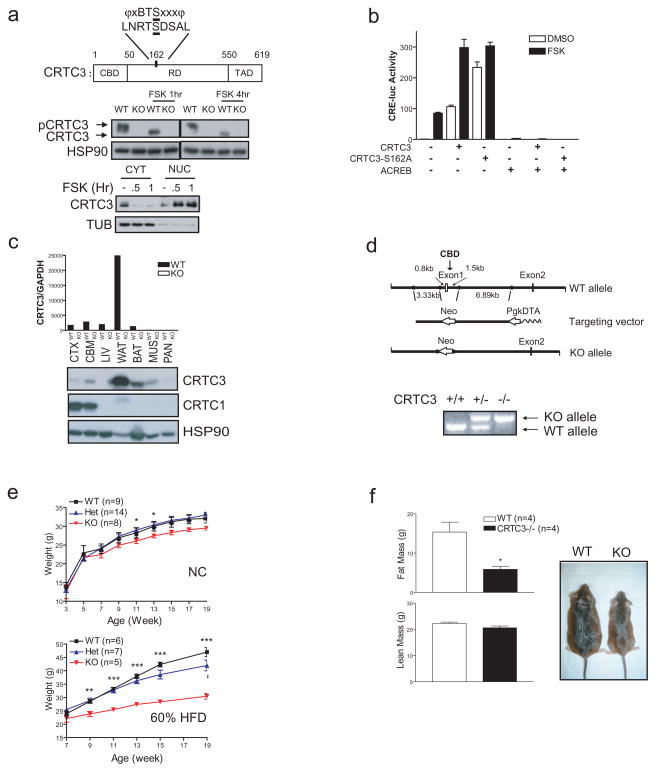
Figure 1.
CRTC3−/− mice are resistant to diet induced obesity. A. Top, schematic of CRTC3 protein showing CREB Binding (CBD: aa. 1–50), regulatory (RD; aa. 51–549), and transactivation (TAD: aa. 550–619) domains as well as regulatory Ser162 site, which corresponds to a consensus phosphorylation site for AMPK family members. Middle, immunoblot showing effect of FSK on de-phosphorylation of CRTC3 in wild-type and CRTC3−/− mouse embryo fibroblasts (MEFs) exposed to FSK for 1 or 4 hours. Bottom, immunoblot showing nuclear and cytoplasmic amounts of CRTC3 in NIH-3T3L1 pre-adipocytes under basal conditions and following exposure to FSK. B. Effect of FSK on CRE-luciferase reporter activity in HEK293T cells following over-expression of wild-type or phosphorylation-defective S162A CRTC3. Co-transfection of dominant negative A-CREB expression vector indicated. C. Q-PCR (top) and immunoblot (bottom) analysis of CRTC3 mRNA and protein amounts in different tissues in wild-type and CRTC3 −/− (KO) mice. CRTC1 protein amounts shown for comparison. (CTX; cortex. CBM; cerebellum. LIV; liver. WAT, BAT; white and brown adipose. MUS; muscle. PAN; pancreas.) D. Top, schematic showing structure of the CRTC3 targeting vector containing Neo selection marker in place of Exon 1, which encodes the CREB binding domain (CBD). Structure of the mutant CRTC3 allele after homologous recombination indicated. Bottom, PCR analysis showing wild-type and mutant CRTC3 alleles in genomic DNA from wild-type, heterozygous, and homozygous CRTC3 knockout mice. E. Relative weight gain in wild-type and CRTC3 mutant (Het, KO) littermates under normal chow (12% of calories from fat; top) or high fat diet feeding (HFD; 60% of calories from fat; bottom) conditions. Age (in weeks) indicated. (*; P<0.05. **; P<0.01. ***; P <0.001.) F. Left, relative fat and lean mass in HFD-fed wild-type and CRTC3−/− mice by MRI analysis. Right, representative photo of HFD-fed wild-type and CRTC3−/− mice. (*; P<0.05)

