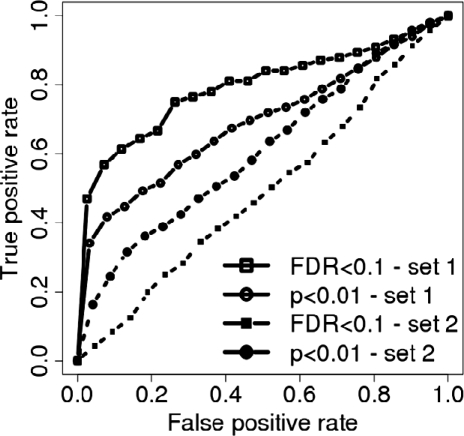
Fig. 6.
Effect of significance cutoff choice. In this example, we use Connectivity Map data (Lamb et al., 2006) to compute the EPSA score for two sets of Query and corresponding Reference signatures as described (N = 5) and compute the respective ROC curves. Query set 1 is a set of compound-vehicle comparisons with a relatively large number of genes with low P-values. Set 2 is a more ‘difficult’ set of comparisons where the number of differentially expressed genes for each signature and cutoff is lower. For set 1, the FDR cutoff results in a better ROC curve than for P-value cutoff (upper two curves) while for set 2, the less conservative P-value cutoff produces a better ROC curve than the FDR cutoff (lower two curves).

