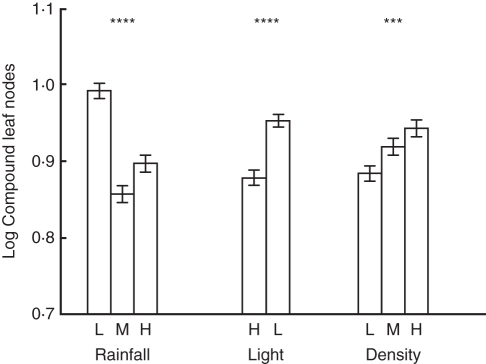
Fig. 2.
Compound leaf nodes represents the total number of nodes that developed a compound leaf before the onset of transitional leaves. Displayed are means (± s.e.) for low (L), medium (M) and high (H) levels for each variable. *** P < 0·001; **** P < 0·0001. Complete statistical results are presented in Supplementary Data Table S3 (available online).

