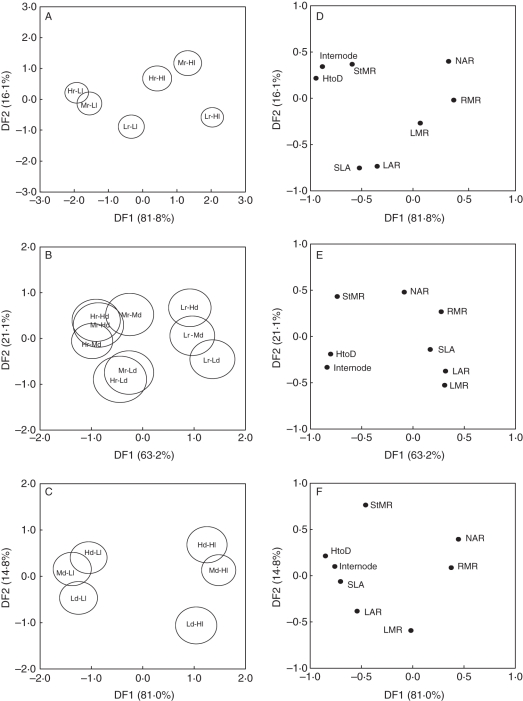
Fig. 5.
Grouping of population, light and density treatments following discriminant function analysis for whole-plant traits. Displayed are group centroids with circles indicating 95 % CIs for whole-plant and leaf-level traits (overlapping circles indicate no difference between groups). Variance explained by first and second discriminant functions are displayed in brackets. (A) Hr-Ll, Mr-Ll, Lr-Ll, high rainfall, medium rainfall, low rainfall population by low quality light treatments; and Hr-Hl, Mr-Hl, Lr-Hl, high rainfall, medium rainfall, low rainfall population by high quality light treatments. (B) Hr-Hd, Mr-Hd, Lr-Hd, high rainfall, medium rainfall, low rainfall population by high density treatments; Hr-Md, Mr-Md, Lr-Md, high rainfall, medium rainfall, low rainfall population by medium density treatments; and Hr-Ld, Mr-Ld, Lr-Ld, high rainfall, medium rainfall, low rainfall population by low density treatments. (C) Hd-Ll, Md-Ll, Ld-Ll, low quality light by high, medium and low density treatments; and Hd-Hl, Md-Hl, Ld-Hl, high quality light by high, medium and low density treatments. (D–F) Factor loadings of whole-plant traits corresponding to DFA of treatments across first and second discriminant functions. See Table 2 for abbreviations.

