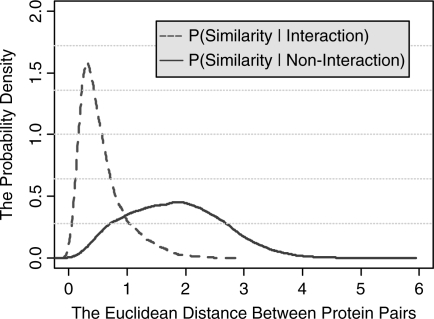
Fig. 3.
The probability density functions p(Similarity|Interaction) and p(Similarity|Non-interaction) learned from embedding the components of the S.Cerevisiae PPI network into 3D metric space. The x-axis denotes the distance between pairs of points in the embedded space. The y-axis denotes the value of probability density function. In the Supplementary Materials, we showed the probability density functions when the components of PPI network are embedded into 2 ∼ 10-dimensional metric spaces.

