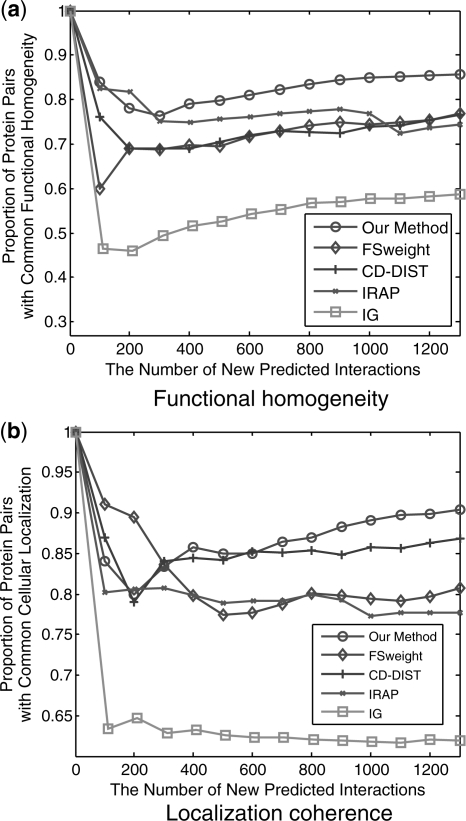
Fig. 7.
Comparison of Our method, IG, IRAP, FSWeight and CD-DIST indices on their correlation with (a) functional homogeneity and (b) localization coherence in predicting new interactions. The vertical axis is the proportion of interacting protein pairs which share a common function or cellular localization. The horizontal axis is the number of new predicted interactions.

