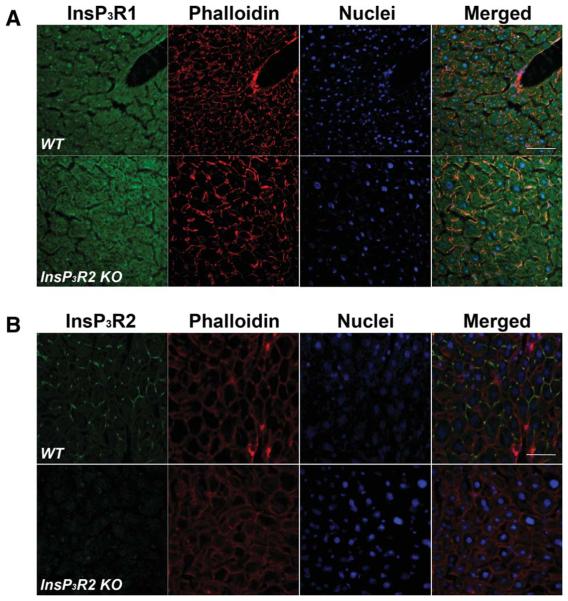
Fig. 2.
Cellular localization of InsP3R isoforms in WT and InsP3R2 KO liver. Confocal immunofluorescence microscopy was used to determine the subcellular localization of each InsP3R isoform. (A) InsP3R1 is diffusely distributed in the cytosol of both types of hepatocytes. Top row shows the diffuse distribution of InsP3R1 (green) in WT liver. Subcortical f-actin is shown in red to reveal the outline of individual hepatocytes. Nuclei (blue) were stained with TO-PRO3. The rightmost panel shows the merged image. Note that the expression level and subcellular distribution of InsP3R1 is similar in InsP3R2 KO liver (bottom row). (B) InsP3R2 is concentrated near the canalicular membrane of WT (top left panel) hepatocytes but is absent in InsP3R2 KO liver (bottom left panel). Expression of InsP3R3 is absent from hepatocytes in livers from both types of mice (data not shown). Scale bar = 50 μm.

