Fig. 3.
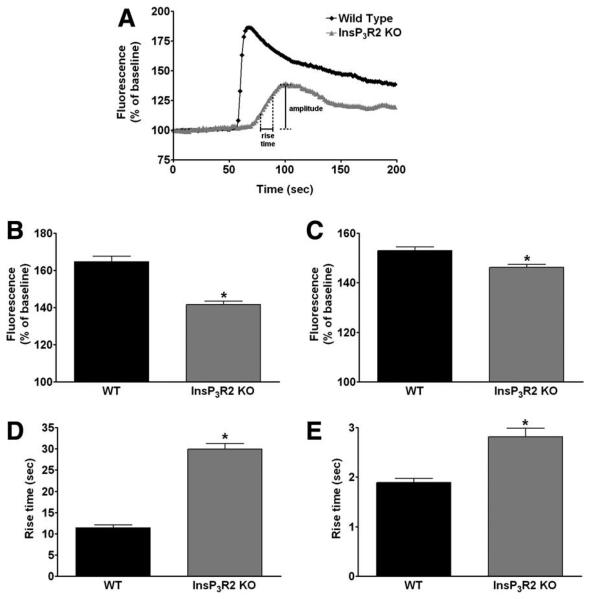
Ca2+ signaling is impaired in InsP3R2 KO hepatocytes. (A) Representative tracing of Fluo4 fluorescence changes over time in WT and InsP3R2 KO hepatocytes stimulated with ATP (100 μM). Hepatocytes were stimulated with either ATP or AVP and examined by time-lapse confocal microscopy. Using these individual tracings, the amplitude and the rise time of the Ca2+ signal from individual hepatocytes was determined. (B) The increase in Ca2+ induced by AVP (10 nM) was greater in WT as compared with InsP3R2 KO hepatocytes (165 ± 3%, n = 309 cells versus 148 ± 2%, n = 423 cells; P < 0.0001). (C) ATP (100 μM)-induced Ca2+ release also was greater in WT as compared with InsP3R2 KO cells (152.9 ± 1.16%, n = 149 versus 146.2 ± 1.18%, n = 176; P < 0.001). (D) Rise time of Ca2+ signal was faster in WT hepatocytes than in InsP3R2 KO cells perfused with AVP 10 nM (11.43 ± 0.71 seconds, n = 251 versus 29.96 ± 1.30 seconds, n = 256; P < 0.0001). (E) Rise time also was shorter in WT than in InsP3R2 KO cells when ATP 100 μM was used to induced Ca2+ release (1.89 ± 0.08 seconds, n = 149 cells versus 2.81 ± 0.17 seconds, n = 176 cells; P < 0.0001), reflecting slower Ca2+ release in cells lacking InsP3R2.

