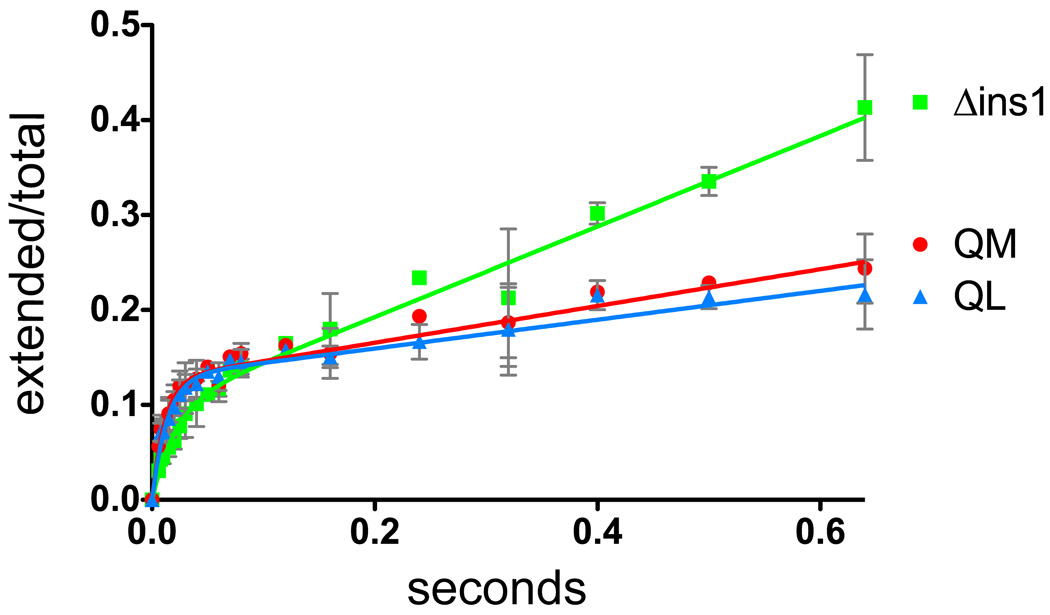
Figure 4.
Pre-steady state burst curves for incorporation of A opposite T by the QL and QM truncations of POLQ and the deletion mutant of insertion 1 (Δins1). The curves are fit to the equation P=A(1-e−kt)+ksst as described in the Materials and Methods. The curve for Δins1 is shown in green, that for QM is shown in red and that for QL is shown in blue. The error bars represent one standard deviation based on at least three separate experiments and are shown in grey.

