
Table 5.
Estimates and standard errors (in parentheses) of the percent increase in cardiovascular hospital admissions associated with a 1 interquartile range (IQR) increase in the chemical component using standard maximum likelihood (MLE), regression calibration (RegCal), and the 2-stage Bayesian model (Bayes). The values shown are 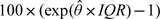 . For the 2-stage Bayesian model,
  is the posterior mean. The IQRs for each component are expressed in μg/m3 and are 3.06 (sulfate), 1.64 (nitrate), 0.07 (silicon), 0.40 (EC), 3.18 (OCM), 0.11 (sodium ion), and 1.35 (ammonium)
| US county | Method | Estimates (standard errors) |
||||||
| Sulfate | Nitrate | Silicon | EC | OCM | Sodium Ion | Ammonium | ||
| Los Angeles, CA | MLE | 0.66(1.10) | 0.10(0.24) | − 0.38(0.59) | 1.25(0.61) | − 0.65(0.88) | 0.34(0.41) | 0.17(0.44) |
| RegCal | 1.29(2.17) | − 0.02(0.42) | − 0.47(1.15) | 3.74(2.02) | − 2.90(1.73) | 4.01(2.35) | − 0.02(0.80) | |
| Bayes | 1.30(2.22) | 0.00(0.41) | 0.81(1.56) | 4.02(1.99) | − 2.64(1.61) | 4.93(1.64) | − 0.04(0.82) | |
| Cook, IL | MLE | − 0.79(0.65) | − 0.16(0.42) | 0.31(0.30) | − 0.06(0.56) | − 0.79(0.87) | 2.05(0.93) | − 0.55(0.55) |
| RegCal | − 0.78(0.77) | 0.32(0.52) | 0.50(0.46) | 0.25(1.24) | − 0.05(1.29) | 5.85(3.09) | − 0.26(0.68) | |
| Bayes | − 0.80(0.76) | 0.30(0.52) | 0.63(0.49) | 0.02(1.33) | − 0.27(1.32) | 4.13(0.98) | − 0.27(0.68) | |
| Maricopa, AZ | MLE | − 0.49(6.93) | 0.65(1.42) | 0.18(0.28) | 0.66(0.71) | 0.02(1.10) | − 1.74(1.00) | 3.79(3.46) |
| RegCal | 9.80(10.67) | 2.76(2.72) | 0.46(0.82) | 3.21(2.73) | 1.28(2.68) | − 1.40(5.56) | 6.91(4.83) | |
| Bayes | 8.96(11.03) | 1.78(2.89) | 0.40(0.86) | 2.89(2.85) | 1.00(2.75) | 1.36(4.30) | 6.49(5.16) | |
| San Diego, CA | MLE | − 0.16(2.39) | 0.67(0.67) | 1.15(0.90) | 2.00(1.24) | 3.02(1.27) | 0.05(0.41) | 0.10(1.15) |
| RegCal | 0.58(3.58) | 0.50(0.76) | 1.05(1.15) | 4.13(2.51) | 2.46(2.11) | − 1.30(2.80) | − 0.06(1.33) | |
| Bayes | − 0.38(3.76) | 0.64(0.78) | 1.46(1.12) | 5.97(2.70) | 3.03(2.21) | − 2.02(2.73) | − 0.26(1.38) | |
| Queens, NY | MLE | 2.31(1.03) | 0.64(0.96) | 0.96(0.87) | 0.53(0.78) | 0.17(0.96) | 0.10(0.06) | 1.44(0.88) |
| RegCal | 2.47(1.11) | 0.90(1.00) | 0.84(1.37) | 2.15(1.28) | 0.80(1.19) | 1.24(0.68) | 1.82(0.98) | |
| Bayes | 2.68(1.15) | 0.82(1.04) | 1.04(1.55) | 1.35(1.43) | 0.63(1.22) | 1.27(0.68) | 1.90(1.04) | |