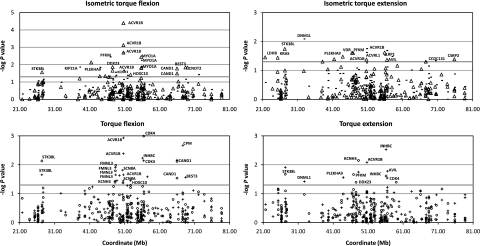
Figure 3.
Family-based association results for selected strength measurements using single SNP markers. Empirical P-values from HBAT analyses were calculated after 10 000 permutations. Strength measurements at 150° (bold line), at 120° (triangle), at 60°/s (cross) and at 120°/s (circle) are shown. Most suggestive significant results (P<0.05, −log P-value >1.3) were marked with associated genes.

