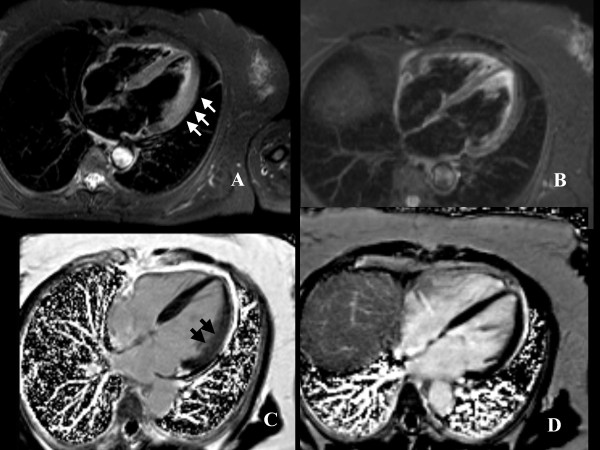
Figure 1.
STIR and LGE images. A, four chamber view, T2-weighted image showing thickening of lateral wall with edema (white arrows); B, post-surgical follow-up T2-weighted images showing normalization of wall thickness and regression of edema; C, post-contrast images showing diffuse myocardial enhancement (black arrows); D, post-surgical follow-up post-contrast images showing regression of myocardial enhancement.

