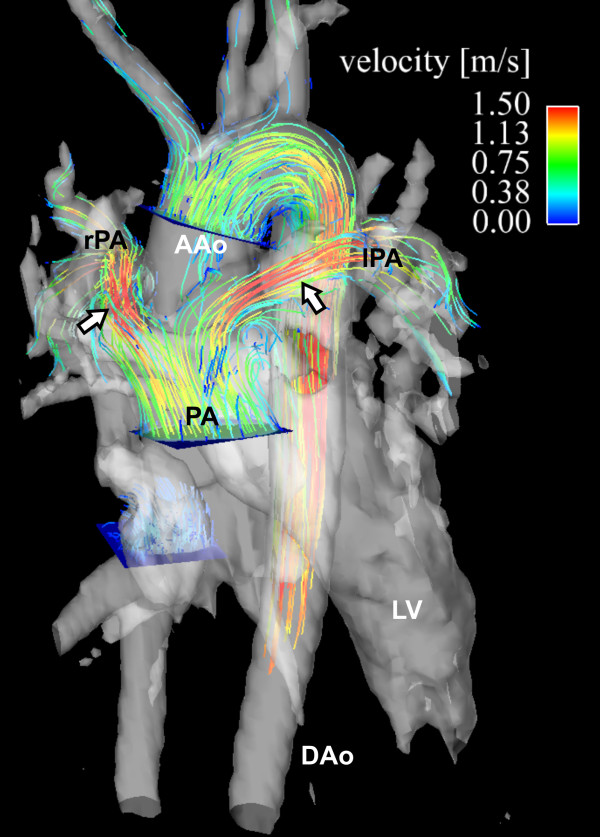
Figure 14.
3D cine velocity acquisition in a patient with transposition of the great arteries corrected by an arterial switch procedure showing the post-surgical course of the pulmonary arteries, straddling the aorta. The 3D pathlines represent systolic flow from emitter planes in the ascending aorta (AAo) and main pulmonary artery (PA). Flow acceleration with peak velocities greater than 1.5 m/s in left (lPA) and right (rPA) pulmonary artery can be seen (white arrows) whereas the flow pattern in the aorta was normal. AAo: ascending aorta.

