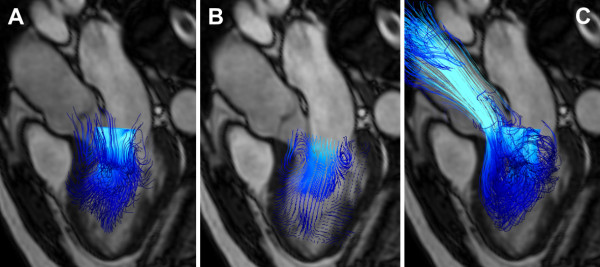
Figure 5.
Demonstration of different particle trace visualization techniques of early diastolic left ventricular inflow in a healthy volunteer. A: Instantaneous streamlines traced at peak early diastolic inflow from a 20 × 20 plane across the mitral valve are used to visualize the directions of blood flow at this time point. B: short streamlines are here traced from multiple points on a 20 × 30 emitter plane oriented in the long axis of the left ventricle. C: Pathlines of virtual particles are traced from their positions at peak early diastolic inflow from a 20 × 20 emitter plane in the mitral valve and computed until end-systole, visualizing the flow paths though the left ventricle and into the ascending aorta. All particle traces are colored coded by velocity; blue represents low velocity, while turquoise represents higher velocity. A separately acquired balanced steady-state free precession three-chamber image provides anatomical orientation.

