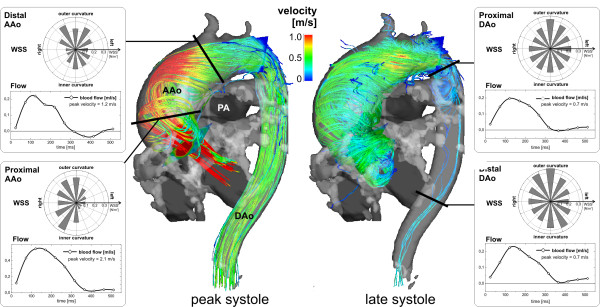
Figure 8.
Flow analysis in a patient with an ascending aortic aneurysm (maximum diameter = 51 mm). 3D stream lines clearly show asymmetric aortic outflow and an accelerated flow channel along the outer aortic curvature and the onset of substantial helical flow during peak systole. The flow helix grows until late systole to occupy the entire ascending aorta and arch. Retrospective quantitative analysis in 4 planes (black lines) was used to evaluate the impact of the altered flow patterns on flow and wall parameters. The complex flow resulted in considerable variation of peak velocities along the aorta. The segmental distribution of wall shear stress (WSS, polar plots) in the ascending aorta (AAo, left) showed heterogeneity along the aortic circumference reflecting the pronounced asymmetry of flow and helix formation. Low WSS at the inner and left aortic curvature or also abnormally high WSS may be associated with altered endothelial function and indicate vascular regions at risk for further arterial remodeling. In contrast, flow in the descending aorta (DAo, right) was relatively normal with more homogenous segmental WWS distribution, i.e. high and more constant WSS along the entire lumen circumference. To view the temporal evolution of 3D aortic blood flow by time-resolved 3D pathlines see additional file 5. (PA: pulmonary artery).

