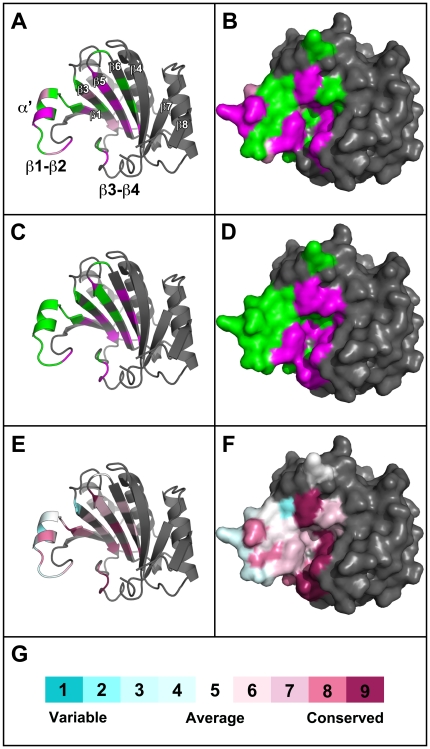
Figure 5. Mapping the biological properties of eIF4E mutants onto the pea crystal structure.
(A and B) Results of the PSbMV infection complementation assay mapped onto chain H of the pea eIF4EΔN51 crystal structure. (A) cartoon representation and (B) surface representation of eIF4E colour coded to depict the three classifications of infection complementation: susceptible-like (S; green), partially-susceptible (S*; pink) and resistant-like (R; magenta). (C and D) Results of the yeast translation complementation assay mapped onto chain H of the pea eIF4EΔN51 crystal structure. (A) cartoon representation and (B) surface representation of eIF4E colour coded to depict the classifications of translation complementation: mutations resulting in full (++) and partial growth (+) are coloured green and those resulting in abolished growth (−) are coloured magenta. (E and F) Results of the evolutionary trace analysis mapped onto chain H of the pea eIF4EΔN51 crystal structure. A sequence alignment was generated for the 68 non-redundant plant eIF4E sequences most closely related to pea eIF4E and was used to calculate the relative degree of evolutionary conservation at each amino acid position through an implementation of the Maximum Likelihood method (see Materials and Methods). A colour-coded scale (G) varying from 1 (highly variable) to 9 (fully conserved) was subsequently mapped onto the cartoon (E) and surface (F) representation of pea eIF4E in the amino acid positions included in the mutagenesis screen.

