Figure 3.
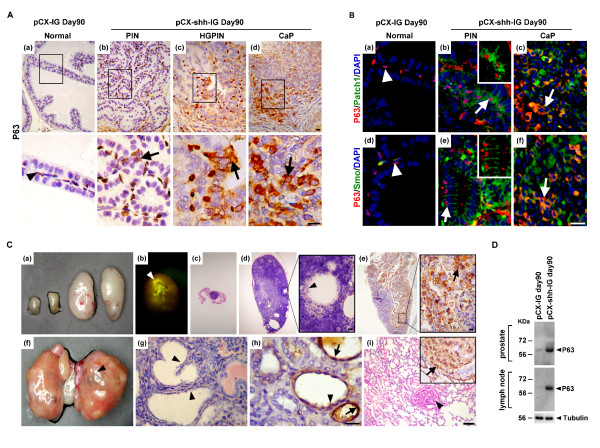
P63+ basal cells are involved in prostate tumorigenesis and progressed into metastatic cancer cells with Hedgehog overexpression. The boxed areas in (A) and (C) are magnified respectively and inlets in (B) correspond to arrow-indicated areas. (A) Increased P63+ basal/stem cell density and altered cellular morphology, including bigger cell size, disoriented polarity, and displaced localization were found along with tumor initiation and progression in the pCX-shh-IG-injected prostate (arrow-indicated in (b), (c) and (d)), in contrast to the normal P63+ cells in the pCX-IG-injected prostate (indicated by arrowhead in (a)). (B) Patch1 and Smo proteins were located within P63+ basal cells in the PIN and CaP of pCX-shh-IG-injected prostate. The P63+/Patch1+ and P63+/Smo+ cells are arrow-indicated respectively in (b) and (e), as compared to those in the pCX-IG-injected prostate (arrowhead in (a) and (d)). Patch1 or Smo was co-expressed with P63+ in some cancer cells of the advanced prostate cancer (arrow-indicated respectively in (c) and (f)). (C) P63+ cancer cells recapitulated prostate-like glandular structure formation in the metastatic loci (arrowhead-indicated in (d), (f), (g), (h) and (i)). Lymph node metastasis is shown by two enlarged specimens on the right of (a) and in (b), (d), (e), as compared to the normal small lymph node in (c) and the two other small specimens on the left side of (a). Note that GFP signals can be detected in the lymph node in (b). Kidney metastasis is shown in (f-h) and lung metastasis in (i). Arrows in (e), (h), and (i) indicate P63+ metastatic cancer cells. (D) Western blot analysis confirmed increased P63+ cells in the prostates and the lymph nodes of the pCX-shh-IG-injected mice. All scale bars: 10 μm. CaP: prostate cancer; PIN: prostatic intraepithelial neoplasia; HGPIN: high grade prostatic intraepithelial neoplasia.

