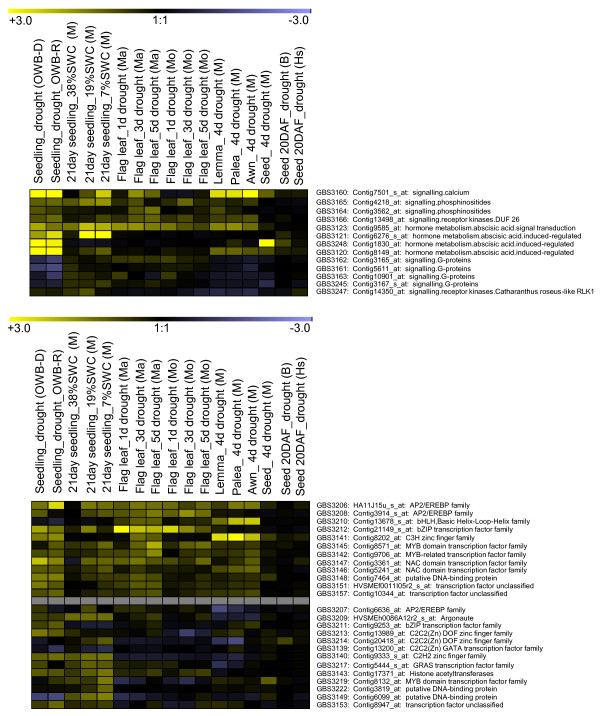
Figure 3.
Expression profiles of mapped barley genes up-regulated by drought stress. Upper panel: hormone and signalling genes, lower panel: transcription factor families. For abbreviations, see Figure 2 legend. Expression data from individual replications are given in Additional file 3.

