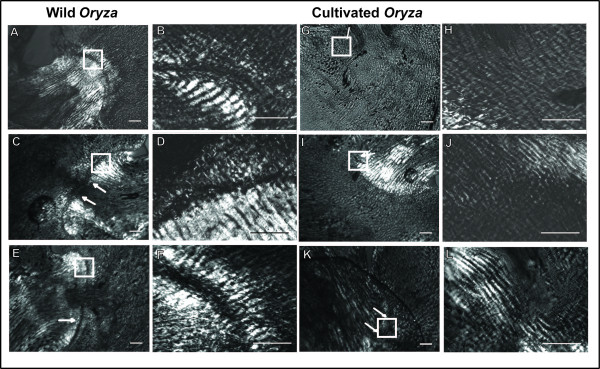
Figure 1.
Comparison of wild and cultivated Oryza flower-pedicel junctions. Panels A-F are wild Oryza (A/B- 2F02 (O. nivara), C/D- 2F01 (O. nivara), E/F- 2C02 (O. rufipogon)). Panels G-L are cultivated O. sativa varieties (G/H- 3A11 (indica), I/J- 3A06 (aus), K/L- 3A08 (indica)). Arrows point to the region of the abscission zone, while white boxes show the region magnified further at right. Abscission layers can be seen as darkly stained bands. All samples shown here were taken at flowering for their respective accession and are all magnified at 10× on the left and 60× on the right. Scale bars on bottom right represent 100 μm for 10× images and 50 μm for 60× images.

