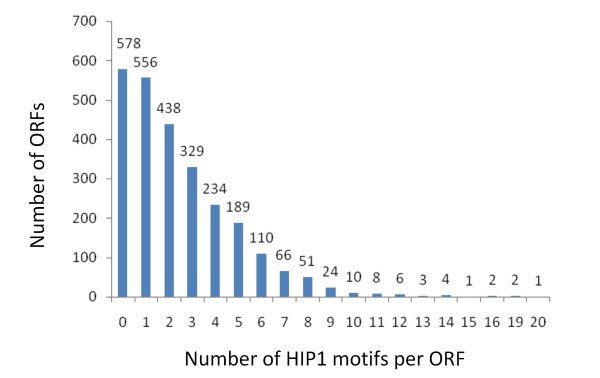
Figure 2.
Distribution of HIP1 motifs per ORF in PCC 7942. The X-axis shows the categories of genes, according to their number of HIP1 motifs. The Y-axis shows how many PCC 7942 genes belong to each category. The distribution is reminiscent of a random process, with most ORFs having none or a few copies of HIP1, and a few ORFs having several ones.

