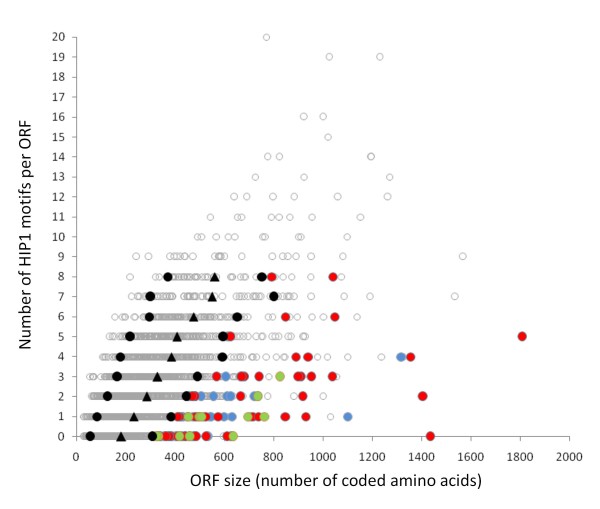
Figure 3.
Distribution of HIP1 motifs per ORF in PCC 7942 versus ORF length. Each dot in the figure represents one gene from the PCC 7942 genome. They are sorted by their number of coded amino acids (X-axis) and by the number of HIP1 motifs in their coding sequence (Y-axis). Black triangles show the mean of the size distribution for each category (0 HIP1 motifs, 1 HIP1 motifs... etc); black circles indicate the positions separated by one standard deviation of the mean; green dots represent ORFs with a codon usage reminiscent of highly expressed genes (PHX); blue dots, genes with codon usage similar to (but not as pronounced as) highly expressed genes (PX); and red dots putative alien genes (PA); gray dots, other genes.

