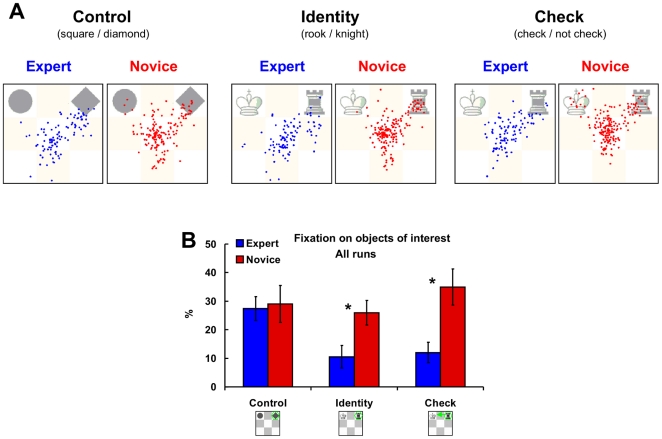
Figure 2. Eye movement data.
(A) All fixations of experts (blue dots) and novices (red dots) on an example stimulus in the Control (left), Identity (middle), and Check (right) task. (B) Average percentage of fixation that falls on objects of interests in a trail in experts and novices in the Control, Identity, and Check tasks averaged across all runs. Error bars indicate SEM. * p <.05 and †p <.10 in a two tailed t-test for independent samples (experts versus novices).

