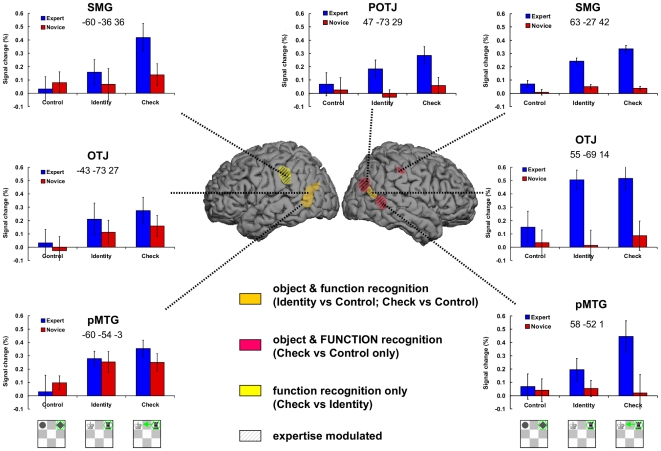
Figure 4. Neuroimagining data summary.
Presents the object specific network based on the three comparisons in Figure 3. Orange color indicates the areas activated in both Identity vs Control, and Check vs Control task comparisons (both separately, not conjunction analsysis); Red indicates the areas activated only in the Check vs Control task (FUNCTION is in capital letters to emphasize that this area explicitly involves function of objects, unlike the areas in orange); Yellow indicates the region significantly activated in the Check vs Identity. Please note the colours are transparent and on the surface of the brain image may look slightly different. The areas modulated by expertise have additional black stripes. In each of these areas the regions of interests (ROI) were taken by selecting the voxels within 3 mm3 of the peak activation (see MNI coordinates below the ROI labels). The activation levels (percent signal change relative to baseline) were extracted for each individual player and averaged across groups and tasks for the first run only (similar results were obtained when all runs were used).

