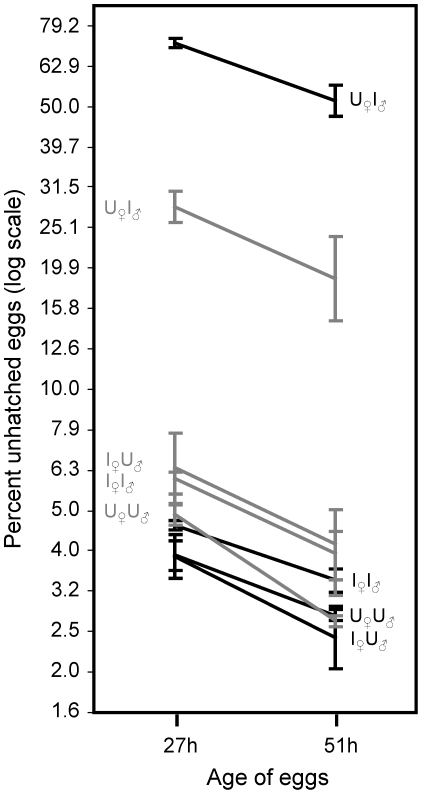
Figure 1. Cytoplasmic incompatibility: male age and embryonic development time.
Proportion of unhatched eggs produced from all four combinations of infected and cured males and females. Males of two ages were used (black lines 1-day-old males, grey lines 3-day-old males) and eggs hatch was scored at two different times (first after 27 h and then again after 51 h). For each line there is a letter combination. The first letter correspond to the infection status (U = uninfected, I = infected) of the female (subscripted with ♀), the second letter refers to the infection status of the male (subscripted with ♂). Note that the Y-axis is log transformed.

