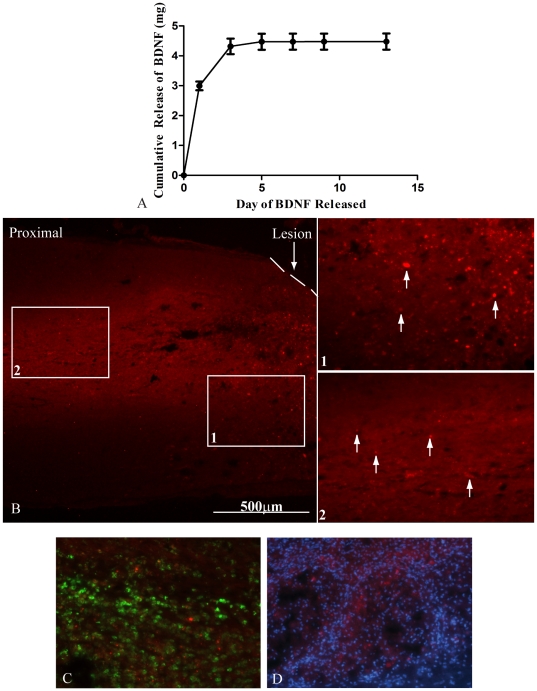
Figure 1. In Vitro and In Vivo Diffusion of BDNF.
A. In vitro release assay of BDNF over the first 2 weeks. The graph shows that an initial burst released 4 µg of BDNF within the first 3 days. An average of 3 ng/day of BDNF was released for the following 11 days. The data represent mean ± SEM B. An image of the proximal region of a spinal cord section after delivery of BDNF/Rhodamine at 4×. The 20× images labeled 1 and 2 are outlined with white boxes in A and demonstrate that BDNF/Rhodamine diffused approximately 2 mm proximal to the lesion site. The dashed line represents the interface between the spinal cord and scaffold. White arrows indicate BDNF/Rhodamine. C. A 20× image of ED-1+ cells (green) and BDNF-Rhodamine (red). The image shows some overlap demonstrating engulfment of the BDNF-Rhodamine by the ED-1+ cells. D. A 20× image of DAPI (blue) and BDNF-Rhodamine (red) demonstrates that not all of the BDNF-Rhodamine is taken up by resident and migrating cells.

