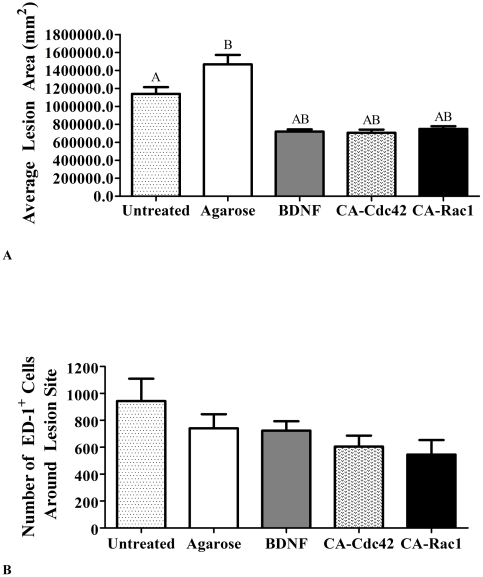
Figure 3. Quantification of lesion area and ED-1+ cells.
A. Average lesion area of the controls and treated spinal cords. The average lesion area was statistically smaller in all of the treated conditions compared to the untreated and agarose controls. The data represent the mean ± SEM. One way ANOVA and Tukey's test were used to statistically analyze the data. (A p<0.05 compared to untreated control and B p<0.05 compared to agarose control). B. Comparison of the number of ED-1+ macrophages/reactive microglia at the interface. This bar graph shows that there was not a statistical difference in the number of macrophages/reactive microglia in the treated animals compared to the untreated and agarose controls. The data represents mean ± SEM.

