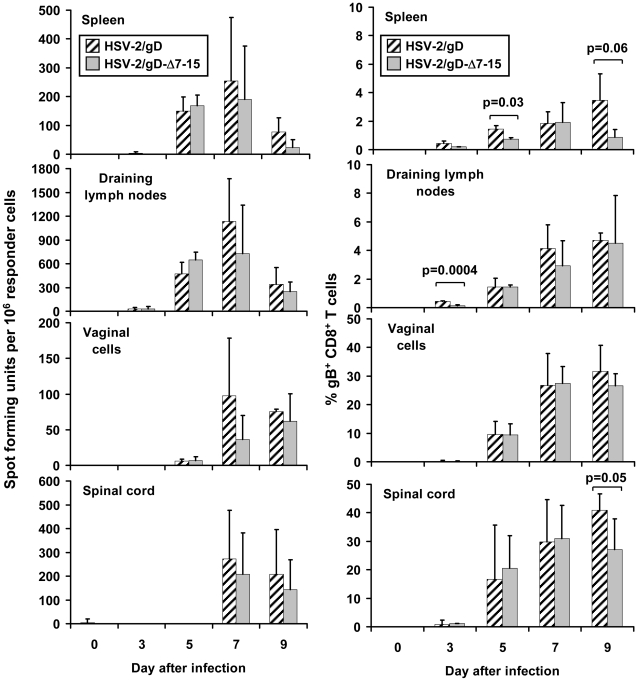
Figure 5. Analysis of HSV-specific CD8+ cells in relevant tissues after infection.
Cells were obtained from mice inoculated with HSV-2/gD or HSV-2/gD-Δ7-15 (0.6×10⁶ PFU/mouse). Left panels: Number of IFN-γ-producing T-cells responding to the immunodominant gB496–503 epitope (SSIEFARL), per 106 leukocytes extracted from the tissues indicated on the days indicated after virus inoculation. Cells isolated from the different tissues were evaluated by IFN-γ ELISPOT. There were no statistical differences in mean values between groups of mice at any time point. Right panels: Quantitation of gB496–503-specific CD8+ T-cells extracted from the tissues indicated on the days indicated after virus inoculation, expressed as a percentage of CD8+ cells. Cells isolated from the different tissues were labeled with fluorescent antibodies to murine CD8 and either CD3 or CD4, along with fluorescently tagged DimerX loaded with gB496–503. Lymphocytes were gated based on forward- and side-scatter, and percentages of DimerX-gB496–503 + CD8+ CD4− cells determined. Results are expressed at the means and SD of 3–12 mice per time point; mean values with statistical differences are highlighted, with p values reported above the data.

