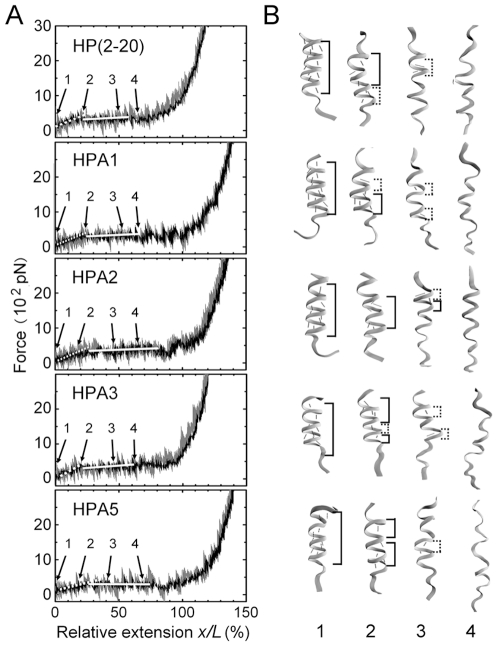
Figure 1. Tensile force F–relative extension x/L curves (A) with four representative conformation snapshots (B) for HP(2–20), HPA1, HPA2, HPA3 and HPA5 respectively.
The weight lines (A) express the mean F–x/L curves, in which both the tensile force and the relative extension are means over five independent stretching events with corresponding different initial conformations for each of these peptides. The light lines (A) are the instantaneous F–x/L curves to express respective tensile events for each peptides, and the number marks (A and B) from 1 to 4 on the curves are used to denote different stretched states of the peptides, being initial, elongated with intact helical chain, unfolded partly and totally, respectively. The accompanied conformation snapshots (B) in the right hand of the F–x/L curves are selected from these different stretched states, respectively. The two different structural parts along the chain, the α-helical and 310-like helical zones, so called for their respective H-bonds from i-th to (i+4)-th residue and from i-th to (i+3)-th residue, are marked (B), respectively. The main-chain H-bonds are represented by red dashed lines (B). The values of the local spring constants can be read from the slopes (A, white lines) of the F–x/L curves in different extension regions.

