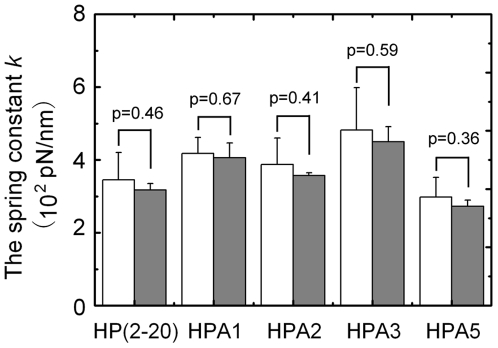
Figure 4. Comparison between values of spring constant k (white bars) read from slopes of F-x/L curves ( Fig. 1 A ) and those (gray bars) estimated by fitting x/L-t curves ( Fig. 3 ) with Langevin equation (Eq. 1) in the region of x/L from zero to 0.2 for HP(2–20), HPA1, HPA2, HPA3 and HPA5, respectively.
The data are presented as mean ± SE of five different values of k extracted from five independent stretching events for each peptide. There were no statistically significant differences in the values of k derived from the two different methods, due to p-values ranging from 0.36 to 0.67 in student t-test, for each of the peptides. The statistical differences in k values among these peptides were similar to those in their corresponding Young's moduli (Fig. 5).

