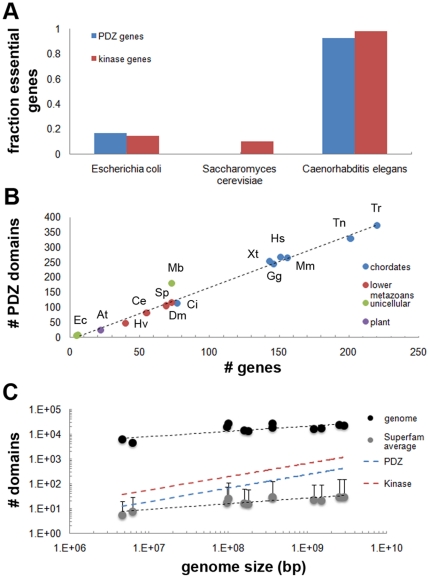
Figure 1. Overview of PDZ domain complements (PDZomes) encoded in model organisms.
(A) The fraction of essential PDZ domain encoding genes rises with increasing genome size. Essential genes were scored for Caenorhabditis elegans (92.7% of all PDZ encoding genes), Escherichia coli (16.7%) and Saccharomyces cerevisiae (0%). See also file S1. (B) Plot depicting a linear relation between the number of PDZ domains and the number of genes that encode them. The mean ratio of PDZs per gene was 1.7 and relatively constant among metazoan organisms. Interestingly, the PDZ to gene ratio was higher for the unicellular choanoflagellate Monosiga brevicollis (Mb), and this unicellular species encoded more PDZ domains and PDZ encoding genes than both lower metazoans and bacteria [9], [21]. (C) Logarithmic plot of genome size and domain content shows that the PDZome increase can be approximated by a power-law (blue). A similar result was observed for the kinase domain superfamily (red). Error bars for the average superfamily size indicate standard deviation.

