Fig 5.
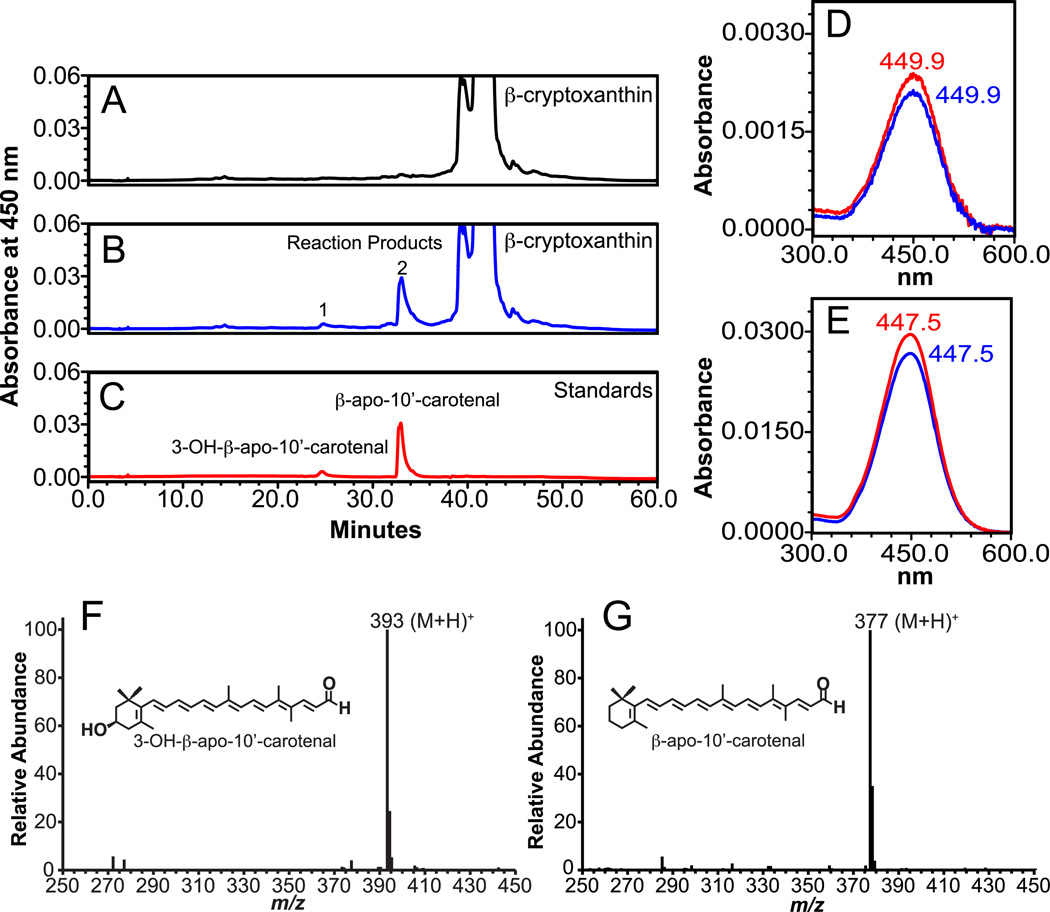
Identification of cleavage products from β-cryptoxanthin by HPLC and LC-MS analysis. β-Cryptoxanthin (100 µM) was incubated with the homogenates from either uninfected (A) or ferret CMO2-baculovirus infected (B) insect cells for 30 min. at 37°C as described in “Experimental Procedures”. The cleavage products were extracted from the incubation mixture and separated by reverse-phase HPLC using a C18 column. Two reaction products (1 and 2) were detected at 450 nm in the incubation mixture containing ferret CMO2-baculovirus infected cell homogenate (B) but not the uninfected SF9 cell homogenate (A). D and E, spectral analysis of the cleavage products (blue line, 1 and 2) of β-cryptoxanthin vs. 3-OH-β-apo-10’-carotenal standard (red line, D) and β-apo-10’-carotenal standard (red line, E). Both the RT and absorption spectrum of reaction product 1 and 2 matched exactly with that of the 3-OH-β-apo-10’-carotenal and β-apo-10’-carotenal standard (C), respectively. LC-MS analysis (F) of peak 1 displayed a base peak of m/z 393, corresponding to (M+H)+ 3-OH-β-apo-10-carotenal product, while peak 2 (G) displayed a base peak of m/z 377, which corresponds to the (M+H)+ of the authentic β-apo-10’-carotenal standard.

