
Figure 1. Annexin 2 deficiency alters HSCs activities.
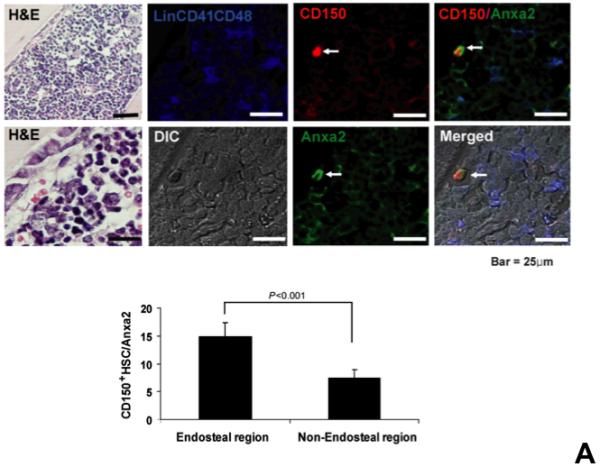
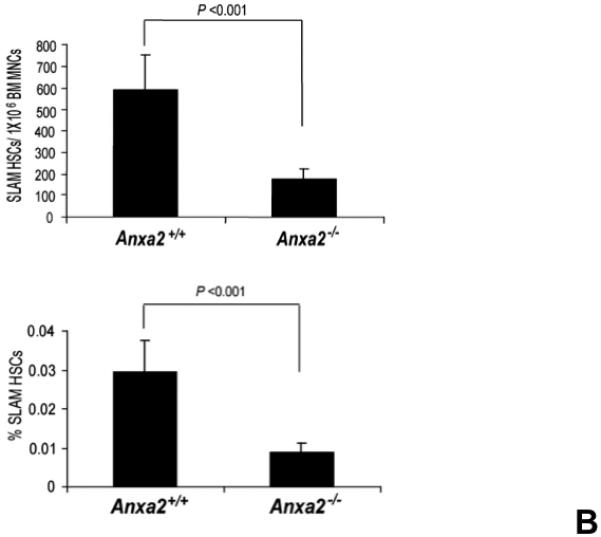
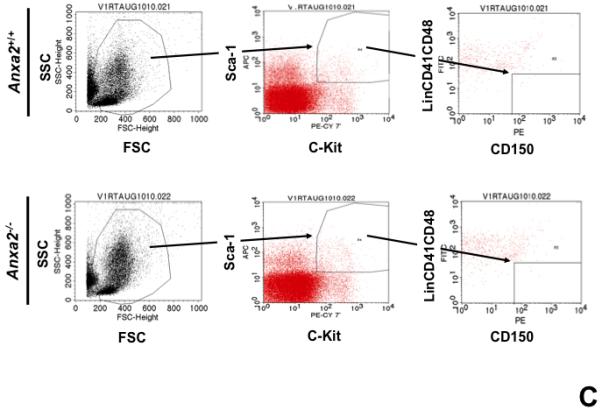
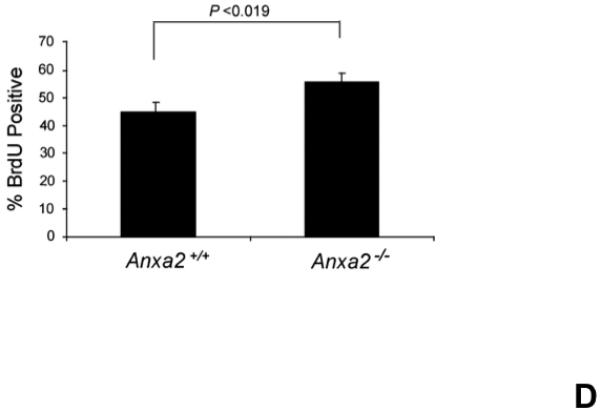
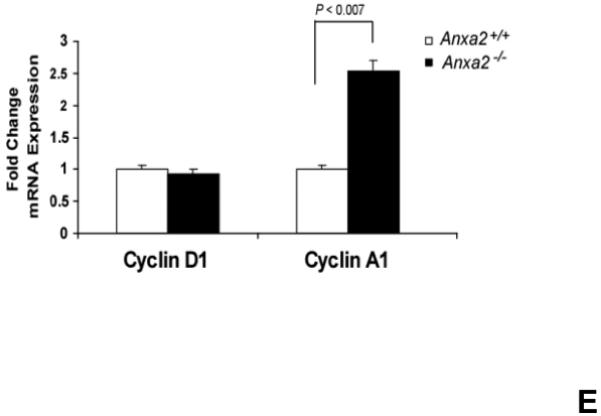
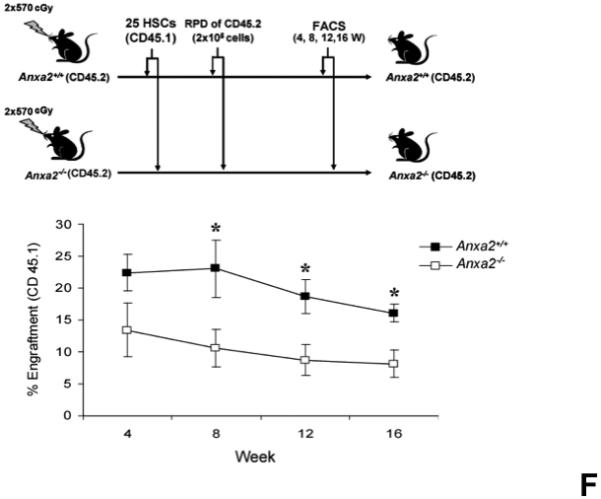
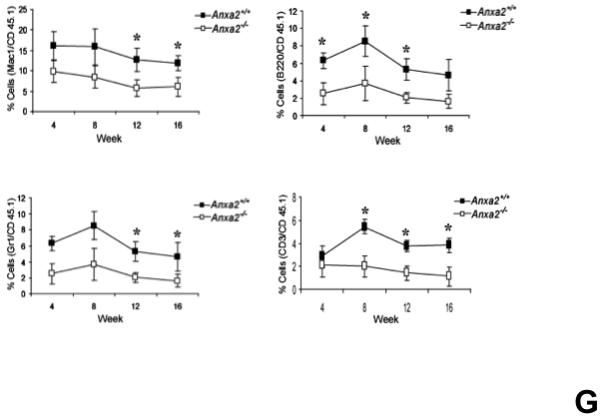
(A) Co-localization of HSCs with annexin 2 in marrow wase determined by H&E stain and immunofluorecent staining. Mouse femurs were stained with H&E (original magnification at 20x and 60x). Lin+CD48+CD41+ cells (blue) were detected by the cocktail antibodies to lineages. Differential interference contrast (DIC) image showed bone structure. HSCs were detected by the antibody to CD150+ (red) without blue coloring (CD150+Lin−CD48−CD41−). Annexin 2 positive cells were detected by anti-annexin 2 antibody (green). Co-localization of HSCs with annexin 2 (yellow) was showed on endosteal surfaces. Merged image showed with DIC and co-localization of HSCs with annexin 2. Original magnification at 60x. Bar = 25 microns. The numbers of co-localization of HSCs with annexin 2 (CD150+HSC/anxa2) were quantified on the serial sections of the 10 long bones from normal wild-type (anxa2+/+) animals. Endosteal regions and non-endosteal region were defined as 12 cell diameters from bone surfaces. (B) The absolute number and percent of HSCs present in the marrow of anxa2−/− vs anxa2+/+ animals were determined by FACS analysis. (C) Histograms of HSCs using SLAM families by FACS analysis. (D) Cell cycle analysis of SLAM HSCs stained with BrdU staining was determined by FACS analysis. (E) mRNA expression of cyclin D1 and cyclin A1 were examined by real-time RT-PCR and normalized to β–actin to determine the proliferating status on HSCs. (F) The percentages of HSC (CD45.1) engraftment in anxa2+/+ (CD45.2) or anxa2−/− (CD 45.2) animals were determined by competitive long-term bone marrow transplant assays at 4 to 16 weeks post-transplant. (G) The repopulating lineages (MAC-1, B220, Gr-1 or CD3 cells) in peripheral blood of anxa2+/+ (CD45.2) or anxa2−/− (CD 45.2) animals were also determined at 4 to 16 weeks post-transplant. Data are presented as the mean ± standard error of the mean. *P< 0.001 significant differences from anxa2 +/+ control groups.