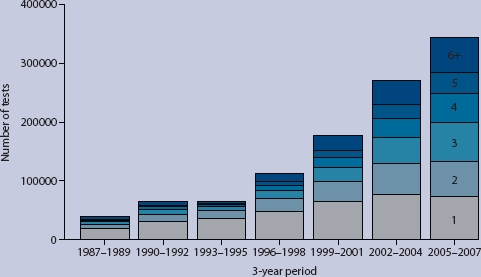
Figure 3.

Total number of tests performed per 3-year period, broken down within each bar by frequency of testing (1, 2, 3, 4, 5, ≥6 tests per person: the darker the shading the greater the test frequency). Tests performed on a total of 355 517 individuals.
