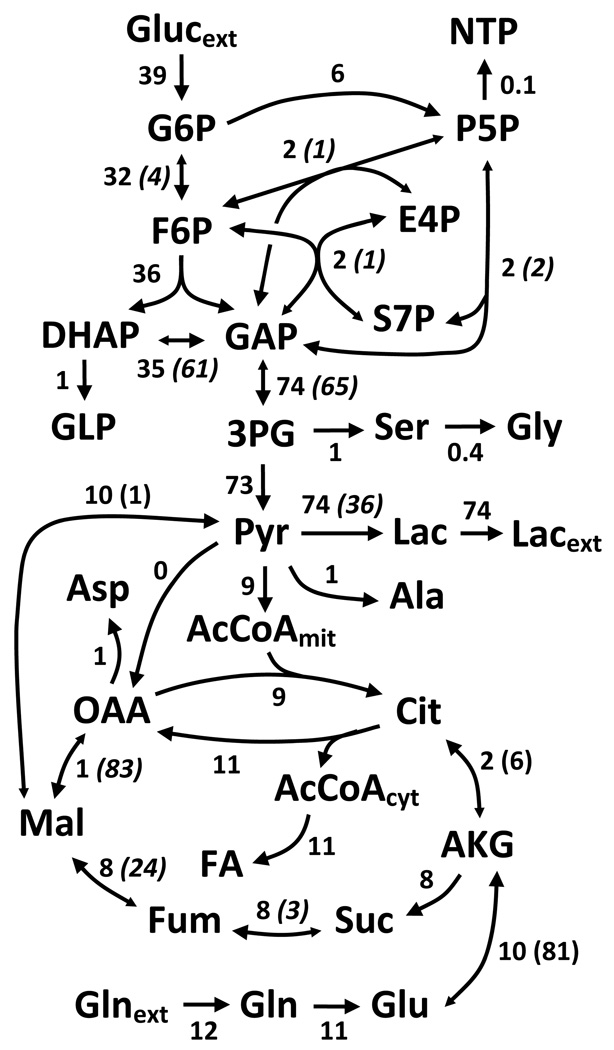
Figure 1.
Experimentally determined fluxes representing central carbon metabolism in tumor cells. Extracellular fluxes and MIDs were measured and incorporated into the network shown (see Supplementary Table 2). An acceptable fit was obtained with a sum of squared residuals (SSR) of 52, well under the upper bound of the 95% confidence region for a χ2 distribution. Net fluxes are listed first for each reaction and exchange fluxes are within parenthesis. Units for all fluxes are nmol min−1 mg protein−1. Italicized numbers represent flux values that were taken from literature since they were unidentifiable for our particular experiment.

