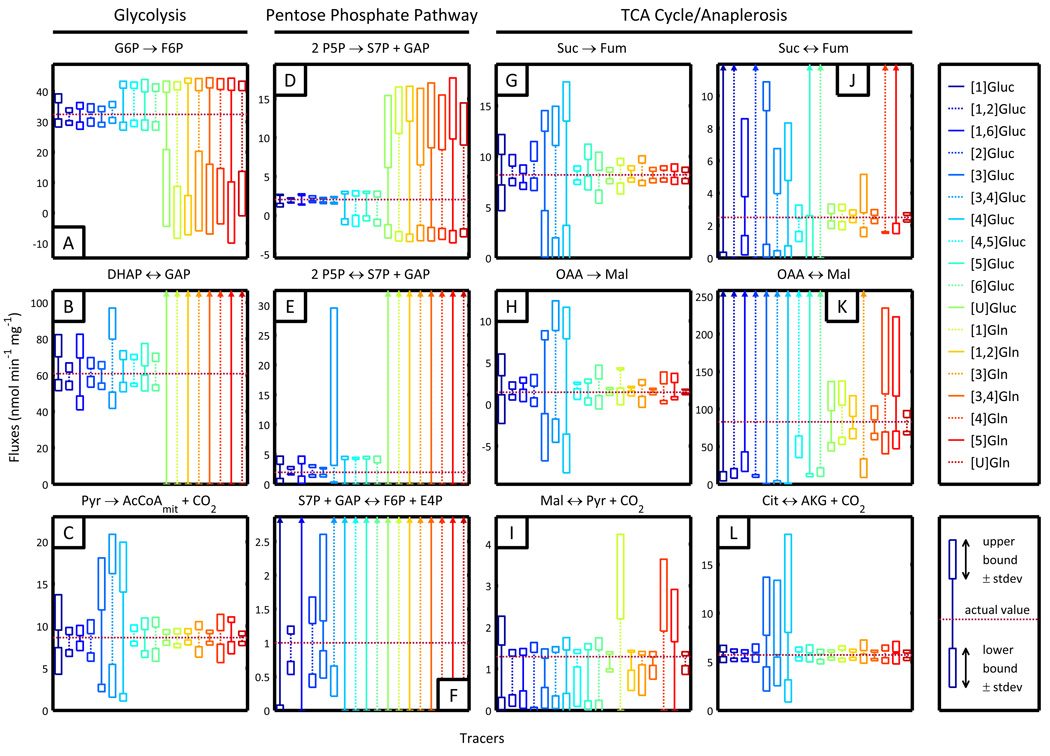
Figure 2.
Simulated confidence intervals for selected fluxes when using specific isotopic tracers. Horizontal dashed lines indicate actual fluxes. Upper and lower bounds of the 95% confidence interval are illustrated for each simulated tracer. The standard error of both upper and lower bounds is represented by the boxes at the top and bottom of each interval. (A) Glucose-6-phosphate isomerase and (B) triose-phosphate isomerase fluxes demonstrate the effectiveness of glucose tracers in estimated glycolytic fluxes. (C) Pyruvate dehydrogenase flux is most precisely estimated by most glutamine tracers and some glucose tracers. (D–F) Net and exchange fluxes within the pentose phosphate pathway are best determined with glucose tracers labeled at the 1st, 2nd, or 3rd carbon, with [1,2]glucose performing best. (G,H) Net fluxes and (I–L) exchange fluxes in the TCA cycle are characterized well using [U]Gluc, [1,2]Gln, [3,4]Gln, or [U]Gln.

