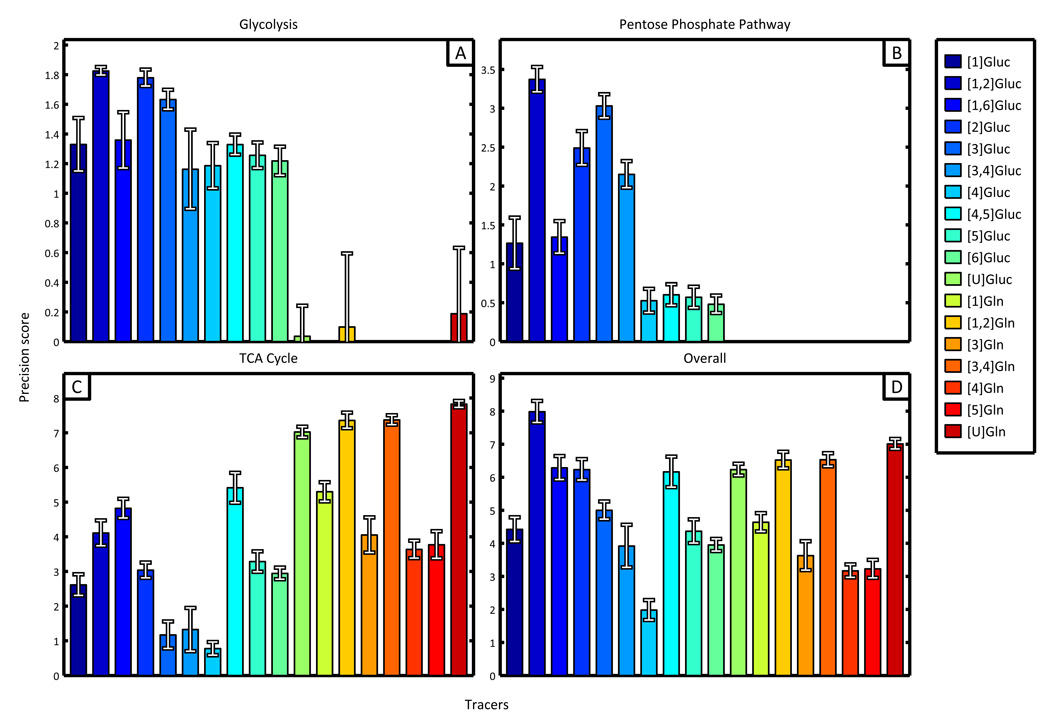
Figure 4.
Results obtained from precision scoring algorithm identify the optimal tracer for analysis of subnetworks and central carbon metabolism. The precision scores resulting from simulated experiments involving only natural labeling have been subtracted from each displayed tracer score to aid in visual differentiation and comparison. (A) Glycolysis and (B) pentose phosphate subnetworks are best described by [1,2]Gluc, [2]Gluc, and [3]Gluc. (C) TCA cycle scores were highest for [U]glucose and several glutamine tracers labeled at two or more carbons. (D) The most precise tracer for analysis of the entire network was [1,2]Gluc.

