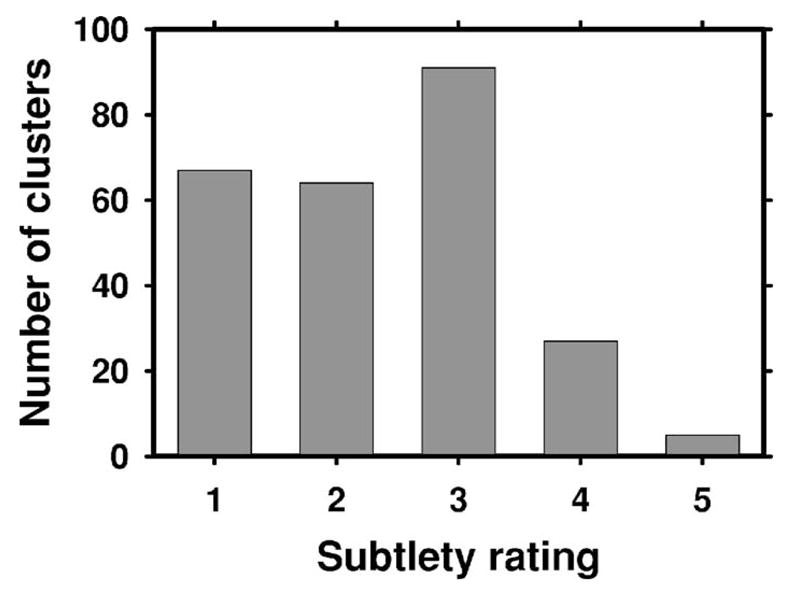
Fig. 2.

The distribution of the subtlety ratings (1: most obvious, 5: most subtle) for the microcalcification clusters in the training data set. The ratings were provided with the USF database. Note that in order to be consistent with our rating scale in which a subtle lesion has a higher rating (e.g., Fig. 4), we reversed the original ratings (and their interpretation) in the USF database for this figure.
