
Fig. 4.
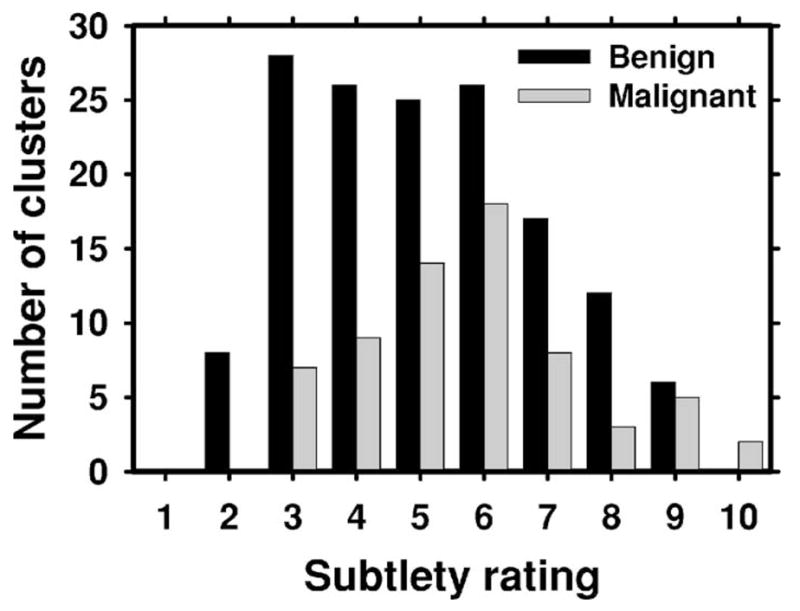
The distribution of the subtlety ratings (1: most obvious, 10: most subtle) for the malignant and benign microcalcification clusters in the test (UM) data set. The ratings were provided by MQSA radiologists at UM.
Official websites use .gov
A
.gov website belongs to an official
government organization in the United States.
Secure .gov websites use HTTPS
A lock (
) or https:// means you've safely
connected to the .gov website. Share sensitive
information only on official, secure websites.
The distribution of the subtlety ratings (1: most obvious, 10: most subtle) for the malignant and benign microcalcification clusters in the test (UM) data set. The ratings were provided by MQSA radiologists at UM.