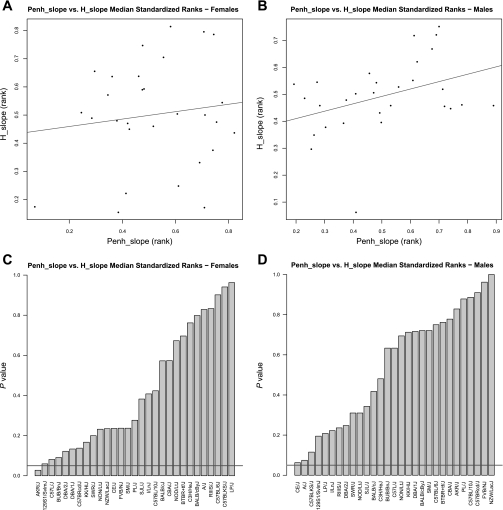
Fig. 5.
Comparison of the median standardized ranks for Penh_slope and H_slope among 29 strains. There is no significant correlation between strain ranks of Penh_slope and H_slope for female (A, Rho = 0.02, P = 0.94) and male (B, Rho = 0.31, P = 0.1) mice. In A and B, the line indicates the line of best fit. P-value distributions of the differences in the strain ranks between Penh_slope and H_slope are shown for female (C) and male (D) mice. In C and D, the horizontal line indicates the threshold at P = 0.05. Strains below the line showed significant differences between the 2 parameters.

