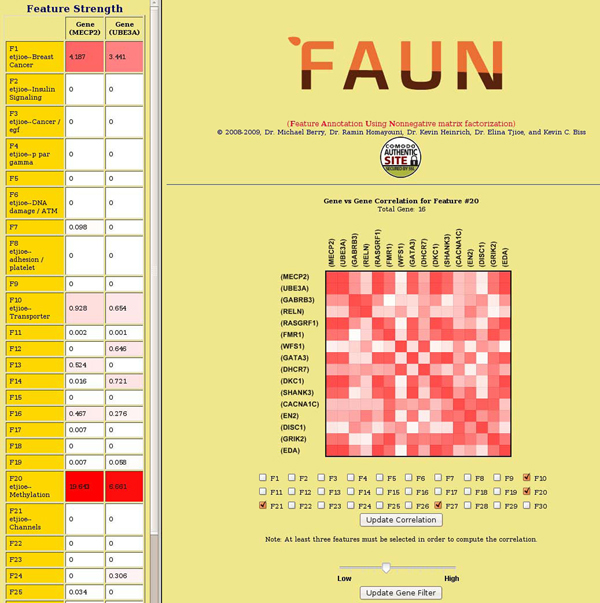
Figure 3.
An illustration of the gene-to-gene correlation FAUN option based on the Pearson correlation of gene features. The rightmost window shows the correlation between genes highly associated with the user-selected features 10, 20, and 27; the leftmost window shows the feature strength (and manually annotated labels) for the genes from the user-selected correlation cell.

