
Figure 2.
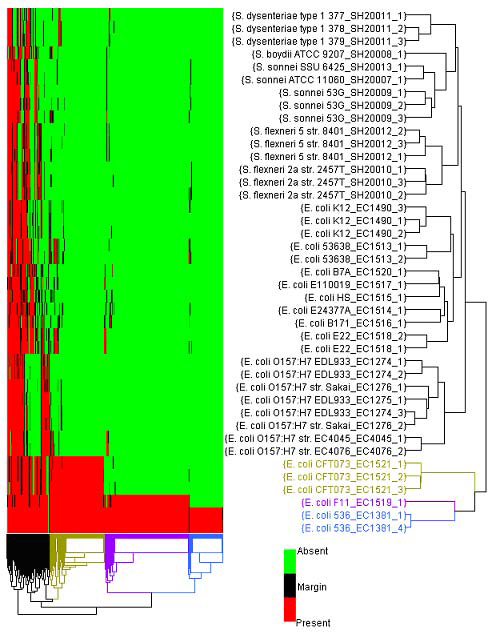
Flag-based hierarchical clustering analysis of all 41 samples in the FDA-ECSG dataset. Flag-based hierarchical clustering analysis of the FDA-ECSG data using a subset of 658 genes known to be associated with the E. coli 536 strain. The green and red colors within the HCA denote absent and present genes, respectively. The bacterial isolates colored in blue, purple, and gold denote the E. coli 536_EC1381, E. coli F11_EC1519 and E. coli CFT073_EC1521 samples, respectively. Their strain-specific genes are also colored accordingly.